講解數字、表格和圖表的簡報。可以學到描述趨勢、比較數字,並說明數據代表的意義。
共30課免費教材。每張投影片都有示範講稿、中文翻譯、音檔和實用句型。可以一頁一頁練習,也可以參考架構準備自己的簡報。
Do We Volunteer? Our Class Survey Results
Society & Politics
#155
Present simple survey results about your class. Practice numbers, "more than half," and "the most popular."
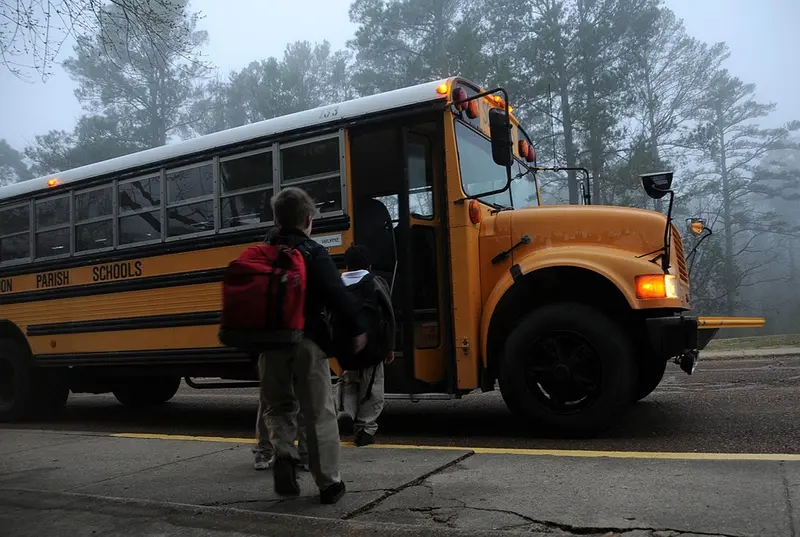
How Does Our Class Get to School? My Survey Results
School & Learning
#116
Present the results of a simple class survey. Practice numbers, "most," "some," and "only a few."
Half of New Businesses Close in Five Years. What Helps the Rest Survive?
Money & Business
#369
Present real survival data on new businesses, share two things that help, and answer a common worry. Practice "According to…", "In other words…", and "That's fair, but…".
I Tracked My Family's Screen Time for a Week. Here's What I Found
Science & Technology
#324
Present the results of your own small data collection and draw conclusions. Practice describing numbers, comparing results, and making suggestions based on data.
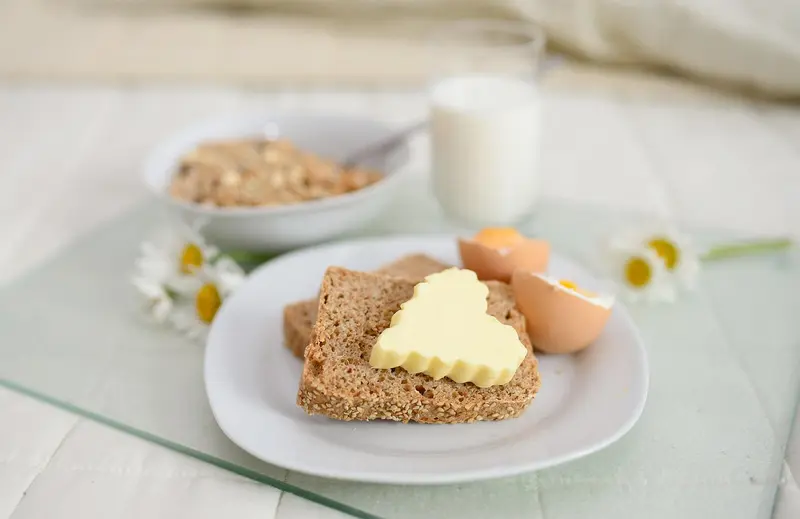
Do We Eat Breakfast Before School? Our Class Survey
#178
Present the results of your own class survey, compare groups, and suggest simple changes. Practice describing results, percentages of a group, and making suggestions.
How Much Water Is Hidden in Our Food?
Environment & Nature
#124
Present surprising data with a chart and explain what it means for everyday choices. Practice comparing numbers and giving practical advice.
I Tracked My Work Hours for a Month. Here's What I Found
Work & Careers
#103
Present results from your own small data project and explain what you changed. Practice describing numbers, comparing categories, and drawing conclusions.
How Much Sugar Is in Our Drinks?
Health & Mind
#091
Present a health guideline and compare it with real products and your own small check. Practice explaining numbers clearly and giving simple advice.
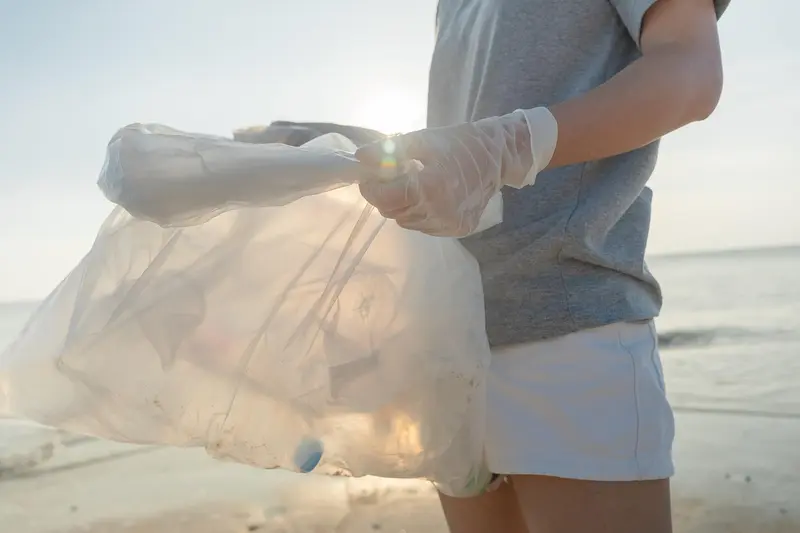
What Our Class Survey Says About Plastic Use
#059
Present data your group collected and turn it into action. Practice explaining a method, reading a chart, calculating totals, and setting a challenge.
What My Survey Says About How My Classmates Spend Their Free Time
Entertainment & Sports
#057
Present the results of a simple survey. Practice explaining a chart, ranking results, calculating percentages, and admitting limits.
What PISA 2022 Tells Us About Math Around the World
#316
A five-minute data talk: present real PISA 2022 results on math scores, a record drop, basic skills, and phones in class, then explain what the numbers can and can't tell us. Practice describing data, comparing numbers, and careful interpretation.
Fewer Than 700,000 Babies: What Japan's 2024 Birth Numbers Mean
#306
Present official statistics, explain what they mean, and discuss causes and responses. Practice describing data, careful cause-and-effect language, and nuanced conclusions.
Nearly 7 Million Students Study Abroad: What's Driving the Trend?
#238
Present international education data, explain possible drivers, and discuss benefits and challenges. Practice describing growth and balancing opportunities with concerns.
Why Are Fewer Japanese People Traveling Abroad?
Travel & Places
#231
Present official data showing a surprising trend, suggest possible reasons carefully, and discuss why it matters. Practice comparing figures and hedging explanations.
Where Do Our Old Phones Go? The Growing E-Waste Problem
#219
Present data from an international report, explain why a problem is growing, and suggest actions for individuals and companies. Practice describing trends and gaps.
Japan's Tourism Boom: Record Visitors and What Comes Next
#215
Present official tourism statistics, explain the reasons behind a trend, and discuss its benefits and challenges. Practice describing growth and balanced analysis.
Why Is the World Moving to Cities?
#209
Present a global trend using UN projections, explain its causes, and discuss challenges for cities and villages. Practice describing projections and cause and effect.
How Much Exercise Do We Really Need? The WHO Guidelines
#207
Present official guidelines and global data, then turn them into realistic personal advice. Practice explaining ranges, comparing data, and persuasive conclusions.
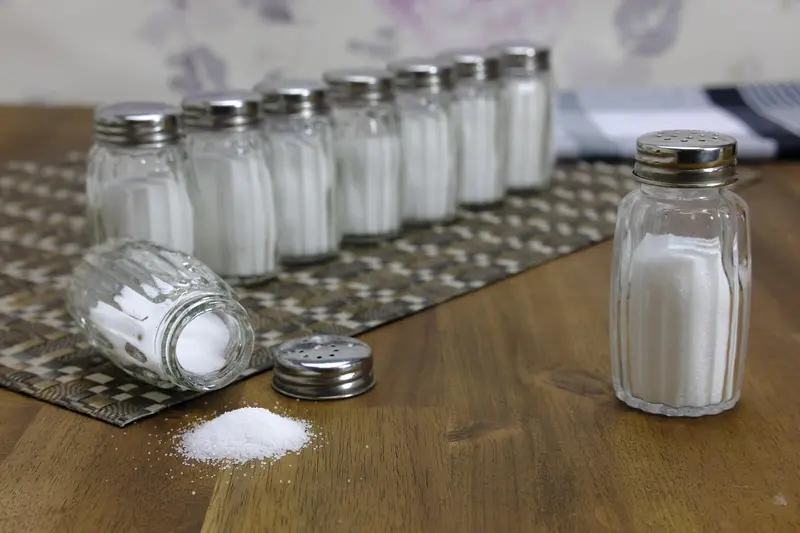
We Eat Twice the Salt We Should: What the WHO Says
#203
Present official health data, explain where the problem comes from, and suggest realistic changes. Practice comparing numbers and giving evidence-based advice.
The Gender Pay Gap: What the OECD Numbers Show
#202
Explain a statistic carefully, including what it does and doesn't measure, compare countries, and discuss responses. Practice precise data language and nuanced argument.
Loneliness Is a Health Problem: What a 2025 WHO Report Says
#175
Present findings from an international report on a sensitive topic, explain why they matter, and suggest small actions. Practice citing a report accurately and speaking with care.
How Much Caffeine Is Too Much?
#166
Present official health guidance and real numbers, compare common drinks, and give careful advice. Practice explaining ranges, limits, and exceptions.
How Much Homework Do Teenagers Do, and Does It Help?
#143
Present OECD data on homework time across countries and family backgrounds, then use research to explain when homework helps and when it stops helping.
2.2 Billion People Are Still Offline. Who Are They, and Why?
#131
Read the latest ITU data on who is offline, explain why with real research, and suggest fair solutions.
Tourism Is Back, but Not Everywhere: What the 2025 Numbers Tell Us
#121
Read the latest UN Tourism data, explain why regions differ, and point out what the numbers can't tell us.
9 Million Empty Houses: What Japan's Numbers Tell Us
#095
Read official housing data, explain the causes, and show how new laws and local ideas are responding.
Are Students Getting Enough Sleep?
#081
A five-minute data talk: compare expert sleep advice and U.S. national survey data with a small class survey, then look at research on phones and school start times to suggest realistic changes.
Where Does Our Food Waste Come From? What the UN Data Shows
#056
A five-minute data talk: use the UN's Food Waste Index 2024, an EU study on date labels, and the UK's results to show where food waste comes from, why homes waste so much, and what actually reduces it.
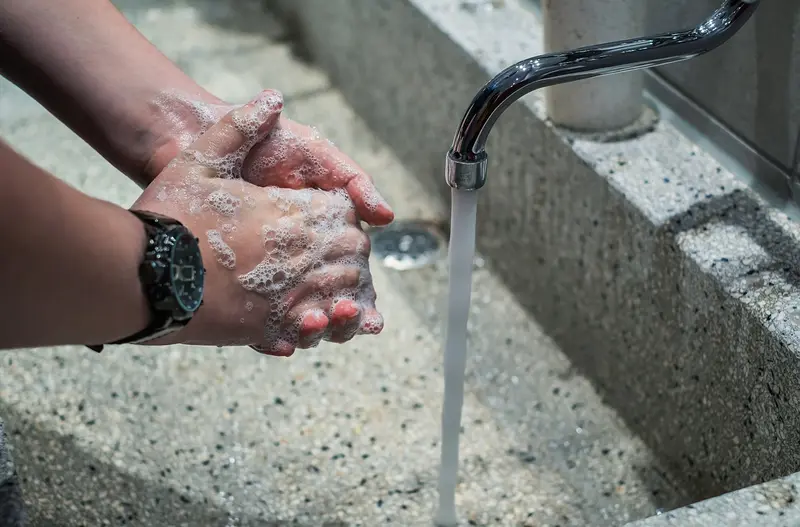
Clean Hands Save Lives. So Why Is It So Hard to Prove?
#358
An Extra-level nursing and public health case study (about six minutes): look at three real studies on hand hygiene, from Vienna in 1847 to a Canadian hospital in 2014, and discuss what each study can and can't prove. Practice explaining a study design, naming its limits, and turning evidence into practical advice.
The Box That's Already Ticked: How Default Settings Change Saving
#356
An Extra-level economics case study (about six minutes): explain the "default effect" with three real cases (a U.S. company, the Save More Tomorrow plan, and UK automatic enrolment), answer the strongest criticism, and give a clear view. Practice presenting research, explaining what numbers mean, and naming a study's limits.